Home / Research / Late filings (NT 10-K / NT 10-Q)
Published 2026-10-19 · updated 2026-10-19 · RedFlagFilings research · 30,460 verified flags from SEC filings, 2015-01-02 to 2026-10-16
Historical averages, not a prediction, a trading strategy or investment advice. Many flagged stocks went up.
When a company cannot file its annual report (10-K) or quarterly report (10-Q) on time, it files a Form 12b-25 notice, shown on EDGAR as NT 10-K or NT 10-Q. The notice buys an extension: 15 calendar days for a 10-K and 5 for a 10-Q. Under SEC Rule 12b-25 a report filed within that extension counts as timely.
We track what happened to every notice: the report came within the extension (timely, the mildest case), came late (after the extension), or was never filed (still missing at our latest check). Notices whose extension is still running are left out because the outcome is not known yet.
| Group | 90 days after the filing | 180 days after the filing | 1 year after the filing | |||||||||||||||
|---|---|---|---|---|---|---|---|---|---|---|---|---|---|---|---|---|---|---|
| n | median return | mean return* | median vs SPY | mean vs SPY* | % trailed SPY | n | median return | mean return* | median vs SPY | mean vs SPY* | % trailed SPY | n | median return | mean return* | median vs SPY | mean vs SPY* | % trailed SPY | |
| All late-filing notices (outcome known) 30,460 flags | 18,448 | -6.7% | -8.6% | -11.6% | -12.5% | 68% | 17,875 | -16.7% | -14.5% | -23.7% | -21.1% | 70% | 16,590 | -33.7% | -21.8% | -46.8% | -34.7% | 74% |
| NT 10-K: filed within extension 6,751 flags | 4,346 | -7.7% | -8.8% | -12.0% | -12.2% | 68% | 4,303 | -16.3% | -14.8% | -23.5% | -21.0% | 70% | 3,935 | -29.0% | -20.1% | -40.1% | -31.9% | 73% |
| NT 10-K: filed late 3,250 flags | 2,025 | -7.1% | -4.8% | -12.9% | -9.6% | 67% | 1,987 | -21.0% | -14.2% | -27.8% | -22.1% | 71% | 1,833 | -33.3% | -10.6% | -45.9% | -25.5% | 73% |
| NT 10-K: never filed 1,055 flags | 383 | -19.3% | -20.9% | -23.6% | -25.9% | 75% | 362 | -51.0% | -47.1% | -60.0% | -54.7% | 83% | 305 | -70.1% | -52.6% | -79.4% | -63.7% | 86% |
| NT 10-Q: filed within extension 12,171 flags | 7,575 | -6.6% | -8.1% | -11.1% | -11.7% | 68% | 7,315 | -16.8% | -14.2% | -23.5% | -20.1% | 70% | 6,902 | -37.5% | -25.0% | -49.2% | -37.7% | 75% |
| NT 10-Q: filed late 5,736 flags | 3,608 | -3.0% | -7.0% | -9.6% | -11.6% | 70% | 3,463 | -7.7% | -8.3% | -16.7% | -16.1% | 70% | 3,219 | -28.6% | -15.4% | -42.6% | -29.2% | 70% |
| NT 10-Q: never filed 1,497 flags | 511 | -28.4% | -30.1% | -30.5% | -34.1% | 78% | 445 | -43.0% | -35.4% | -47.8% | -42.5% | 80% | 396 | -55.1% | -39.3% | -66.5% | -53.7% | 82% |
* Mean = trimmed mean that drops the top and bottom 5% of returns (a few micro-cap returns of +1,000% or more would otherwise dominate). "vs SPY" is the stock's return minus the S&P 500 ETF's return over the same dates, in percentage points.
| Year | Flags | 90 days | 180 days | 1 year | ||||||
|---|---|---|---|---|---|---|---|---|---|---|
| n | median vs SPY | % trailed | n | median vs SPY | % trailed | n | median vs SPY | % trailed | ||
| 2015 | 3,564 | 1,280 | -12.8% | 65% | 1,277 | -23.1% | 68% | 1,273 | -47.1% | 76% |
| 2016 | 3,323 | 1,310 | -8.3% | 62% | 1,309 | -16.5% | 66% | 1,307 | -34.3% | 69% |
| 2017 | 2,941 | 1,315 | -11.9% | 69% | 1,316 | -22.5% | 70% | 1,309 | -38.1% | 73% |
| 2018 | 2,632 | 1,337 | -10.5% | 65% | 1,325 | -20.7% | 67% | 1,324 | -41.9% | 75% |
| 2019 | 2,413 | 1,431 | -17.2% | 73% | 1,431 | -33.4% | 75% | 1,430 | -49.5% | 78% |
| 2020 | 1,778 | 1,242 | -4.8% | 53% | 1,242 | -8.9% | 54% | 1,238 | -3.5% | 51% |
| 2021 | 2,583 | 2,115 | -8.8% | 73% | 2,078 | -13.7% | 71% | 2,024 | -35.3% | 66% |
| 2022 | 2,617 | 2,139 | -7.0% | 63% | 2,093 | -20.9% | 64% | 1,854 | -55.0% | 75% |
| 2023 | 2,901 | 2,165 | -14.6% | 74% | 2,036 | -31.9% | 81% | 1,887 | -73.0% | 85% |
| 2024 | 2,632 | 1,938 | -15.7% | 73% | 1,920 | -32.9% | 76% | 1,818 | -58.6% | 80% |
| 2025 | 1,882 | 1,457 | -14.2% | 70% | 1,434 | -27.1% | 72% | 1,126 | -56.1% | 78% |
| 2026 | 1,194 | 719 | -23.6% | 76% | 414 | -48.4% | 84% | 0 | too few | |
Recent years have fewer completed windows: a 1-year return needs a full year after the filing.
| Market cap at the flag | 90 days after the filing | 180 days after the filing | 1 year after the filing | |||||||||||||||
|---|---|---|---|---|---|---|---|---|---|---|---|---|---|---|---|---|---|---|
| n | median return | mean return* | median vs SPY | mean vs SPY* | % trailed SPY | n | median return | mean return* | median vs SPY | mean vs SPY* | % trailed SPY | n | median return | mean return* | median vs SPY | mean vs SPY* | % trailed SPY | |
| Nano-cap (under $50M) 12,349 flags | 11,853 | -12.2% | -7.0% | -16.7% | -11.1% | 68% | 11,504 | -23.3% | -12.1% | -29.9% | -19.1% | 70% | 10,750 | -40.0% | -16.9% | -52.7% | -30.8% | 75% |
| Micro-cap ($50M-300M) 3,987 flags | 3,800 | -0.6% | -8.5% | -8.1% | -12.2% | 70% | 3,652 | -4.4% | -15.0% | -14.1% | -21.2% | 72% | 3,295 | -22.0% | -24.2% | -34.8% | -35.6% | 73% |
| Small-cap ($300M-2B) 1,956 flags | 1,892 | -1.1% | -8.9% | -8.0% | -12.1% | 68% | 1,844 | -4.7% | -13.8% | -13.5% | -19.3% | 68% | 1,707 | -16.7% | -22.3% | -31.3% | -32.3% | 68% |
| Mid-cap ($2B-10B) 223 flags | 220 | -1.8% | -2.6% | -5.8% | -6.2% | 65% | 216 | -0.7% | -0.5% | -6.3% | -8.6% | 60% | 209 | -2.0% | -1.3% | -15.8% | -15.0% | 67% |
| Large-cap (over $10B) 57 flags | 57 | +1.4% | -1.0% | -3.0% | -4.6% | 58% | 55 | +4.3% | +1.0% | -3.5% | -5.7% | 64% | 51 | +1.6% | -0.3% | -14.5% | -15.0% | 78% |
| Market cap unknown at the flag 11,888 flags | 626 | -8.4% | -14.6% | -14.3% | -18.4% | 72% | 604 | -29.3% | -28.2% | -36.3% | -34.7% | 77% | 578 | -60.4% | -46.8% | -72.0% | -58.2% | 81% |
* Mean = trimmed mean that drops the top and bottom 5% of returns (a few micro-cap returns of +1,000% or more would otherwise dominate). "vs SPY" is the stock's return minus the S&P 500 ETF's return over the same dates, in percentage points.
| Group | 90 days | 180 days | 1 year | |||
|---|---|---|---|---|---|---|
| completed windows | delisting-adjusted | completed windows | delisting-adjusted | completed windows | delisting-adjusted | |
| All late-filing notices (outcome known) | -11.6% | -11.5% (227 stopped) | -23.7% | -23.0% (434 stopped) | -46.8% | -44.4% (877 stopped) |
| NT 10-K: filed within extension | -12.0% | -11.8% (31 stopped) | -23.5% | -23.3% (57 stopped) | -40.1% | -38.2% (158 stopped) |
| NT 10-K: filed late | -12.9% | -12.9% (12 stopped) | -27.8% | -27.4% (27 stopped) | -45.9% | -44.4% (63 stopped) |
| NT 10-K: never filed | -23.6% | -23.6% (24 stopped) | -60.0% | -59.9% (33 stopped) | -79.4% | -77.7% (42 stopped) |
| NT 10-Q: filed within extension | -11.1% | -10.9% (78 stopped) | -23.5% | -22.6% (160 stopped) | -49.2% | -47.1% (326 stopped) |
| NT 10-Q: filed late | -9.6% | -9.6% (45 stopped) | -16.7% | -16.5% (95 stopped) | -42.6% | -39.0% (203 stopped) |
| NT 10-Q: never filed | -30.5% | -29.5% (37 stopped) | -47.8% | -45.6% (62 stopped) | -66.5% | -63.1% (85 stopped) |
Median return vs SPY. The plain figure only counts stocks that still traded at the end of the window. The delisting-adjusted figure also counts stocks that stopped trading first at their last close. Stopping can mean a delisting or bankruptcy, but also an acquisition, merger or going-private deal, and a last close can come before a later loss (for example shares that keep trading over the counter without price data), so the adjustment can move the median either way. Companies that no longer have any ticker are missing from both figures.
| Filed | Company | Flag | Market cap at the flag | 90 days vs SPY | 1 year vs SPY |
|---|---|---|---|---|---|
| 2019-03-01 | LINDE PLC (LIN) | Filing-delay notice, annual report filed within extension (NT 10-K) | $92B | +5.9% | +3.6% |
| 2025-03-03 | Brookfield Asset Management Ltd. (BAM) | Filing-delay notice, annual report filed within extension (NT 10-K) | $90B | -0.1% | -30.7% |
| 2020-03-03 | TRUIST FINANCIAL CORP (TFC) | Filing-delay notice, annual report filed within extension (NT 10-K) | $63B | -20.3% | -0.6% |
| 2024-04-01 | Autodesk, Inc. (ADSK) | Late annual report (NT 10-K) | $56B | -10.2% | -7.0% |
| 2024-11-13 | Discover Financial Services (DFS) | Late quarterly report (NT 10-Q) | $44B | +8.3% | n/a |
| 2020-03-03 | BAXTER INTERNATIONAL INC (BAX) | Filing-delay notice, annual report filed within extension (NT 10-K) | $44B | +4.2% | -36.2% |
| 2021-08-09 | EBAY INC (EBAY) | Filing-delay notice, quarterly report filed within extension (NT 10-Q) | $42B | +6.6% | -20.0% |
| 2025-02-25 | CROWN CASTLE INTERNATIONAL CORP (CCI) | Filing-delay notice, annual report filed within extension (NT 10-K) | $41B | +11.2% | -19.7% |
| 2023-11-29 | Johnson Controls International plc (JCI) | Filing-delay notice, annual report filed within extension (NT 10-K) | $36B | +2.6% | +30.0% |
| 2019-08-08 | Kraft Heinz Co (KHC) | Filing-delay notice, quarterly report filed within extension (NT 10-Q) | $34B | +2.0% | +3.0% |
| 2016-11-09 | ALEXION PHARMACEUTICALS INC (ALXN) | Late quarterly report (NT 10-Q) | $29B | -0.6% | -25.5% |
| 2018-05-10 | PPG INDUSTRIES INC (PPG) | Late quarterly report (NT 10-Q) | $26B | -4.3% | -2.3% |
Every flag in this group where the company was worth at least $10B on the filing date and its stock traded at least $25M a day (one row per company, its latest such flag, largest first). Big companies are rare in this data and are shown for context, not as a sample.
Download the numbers on this page: late-filings.csv · Chart image: cards/late-filings.png · Recent flags of this type: Filing-delay notices (10-K) · Filing-delay notices (10-Q)
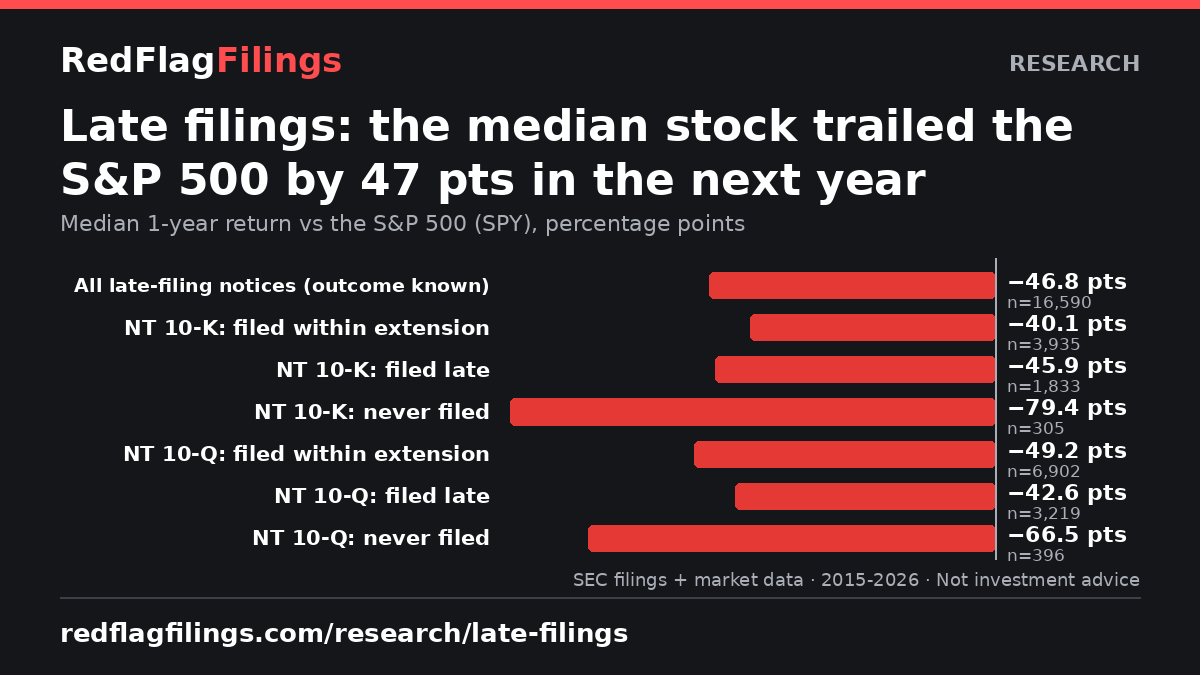
Late filings (NT 10-K / NT 10-Q): across 16,590 flags with a full year of price data (2015-2026), the median stock returned -33.7% and trailed the S&P 500 (SPY) by 46.8 percentage points over the next year; 74% did worse than SPY.
NT 10-K: filed within extension: median 1-year return vs SPY -40.1%, 73% trailed SPY (n=3,935). NT 10-K: filed late: median 1-year return vs SPY -45.9%, 73% trailed SPY (n=1,833). NT 10-K: never filed: median 1-year return vs SPY -79.4%, 86% trailed SPY (n=305). NT 10-Q: filed within extension: median 1-year return vs SPY -49.2%, 75% trailed SPY (n=6,902). NT 10-Q: filed late: median 1-year return vs SPY -42.6%, 70% trailed SPY (n=3,219). NT 10-Q: never filed: median 1-year return vs SPY -66.5%, 82% trailed SPY (n=396).
877 of these stocks stopped trading within a year; counting them at their last trade moves the 1-year median vs SPY from -46.8% to -44.4%.
By size: large caps (over $10B) -14.5% vs SPY over a year (n=51); nano caps (under $50M) -52.7% (n=10,750).
No. These are historical averages computed from SEC filings and market data. They are not a prediction or a recommendation to buy or sell any security, and many flagged stocks went up.
The week's most serious auditor changes, restatements, late filings and going-concern warnings, in plain English. Free. Unsubscribe anytime.
Subscribe to the newsletter →
The signup form didn't load here (often an ad or privacy blocker). This opens beehiiv's secure signup page.
Form not showing? Subscribe on beehiiv →
Newsletter delivered by beehiiv. See our privacy policy.