Home / Research
Research: what happens to stocks after accounting red flags
Updated 2026-10-19 · 106,129 verified red flags from SEC filings since 2015
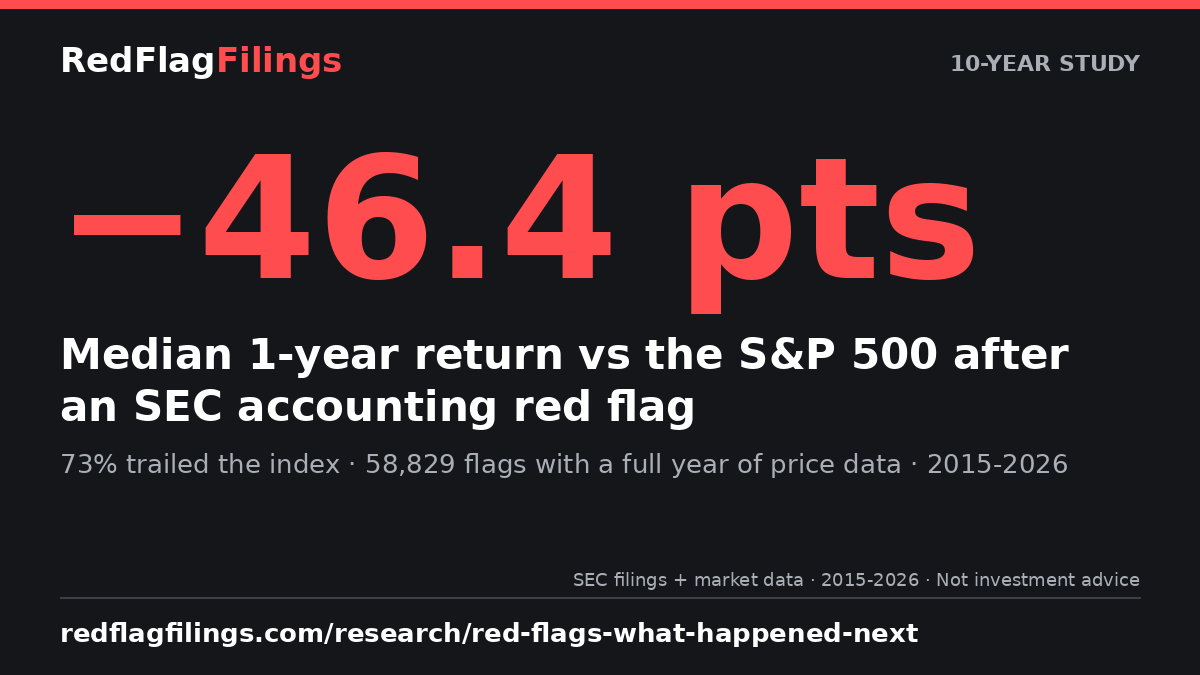
Across 58,829 flags with a full year of price data, the median flagged stock trailed the S&P 500 (SPY) by 46.4 percentage points over the next year, and 73% did worse than SPY.
We follow every verified auditor change, restatement, late-filing notice and going-concern warning since 2015 and measure the stock's return over the next 90 days, 180 days and 1 year against the S&P 500. Start with the 10-year study of all red flags, or pick a flag type below.
Historical averages, not a prediction or investment advice.
Going-concern warnings
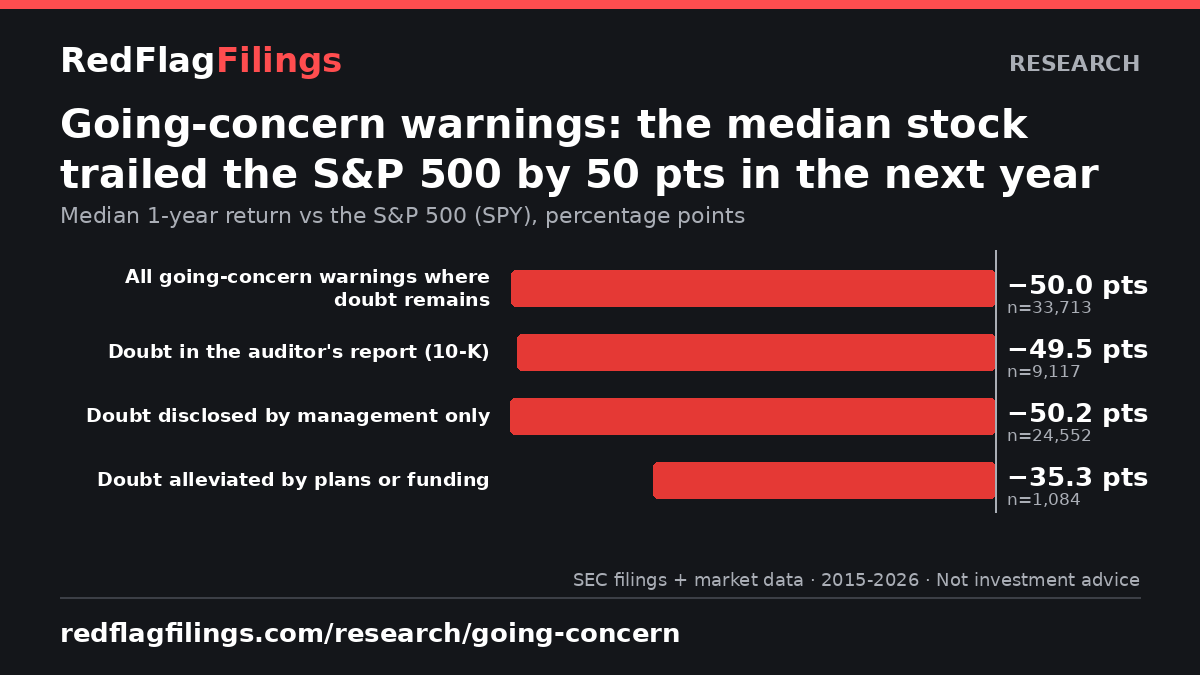
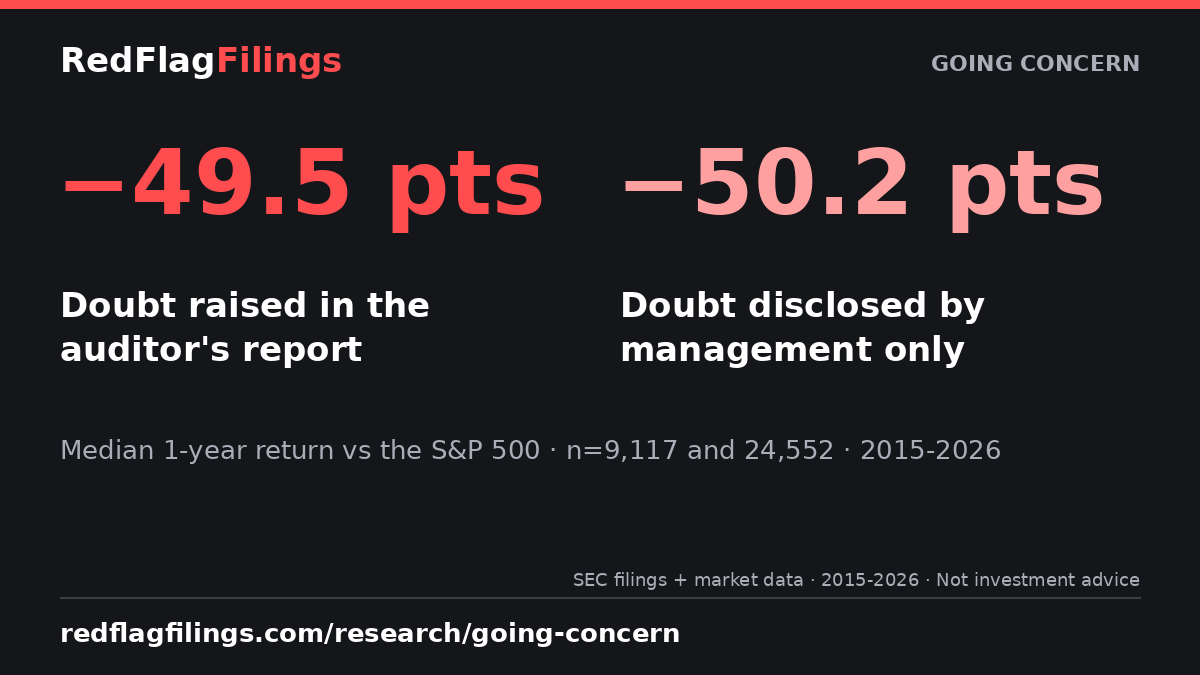
Going-concern warnings: across 33,713 flags with a full year of price data (2015-2026), the median stock returned -36.6% and trailed the S&P 500 (SPY) by 50.0 percentage points over the next year; 74% did worse than SPY.
Late filings (NT 10-K / NT 10-Q)
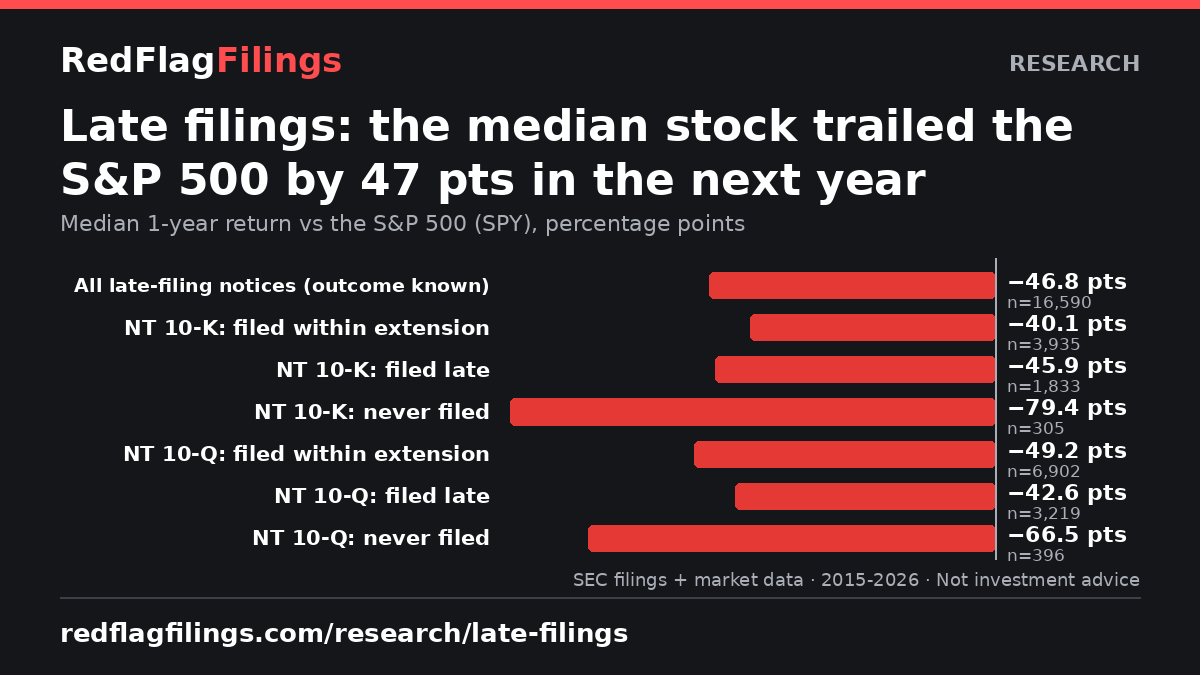
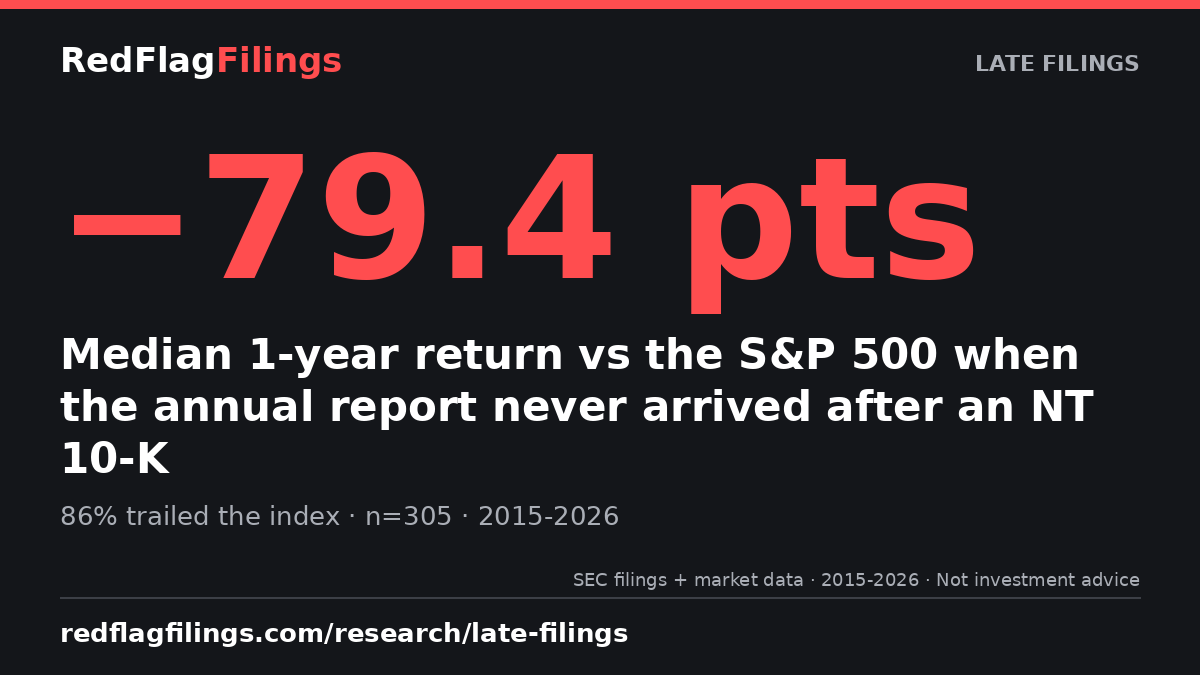
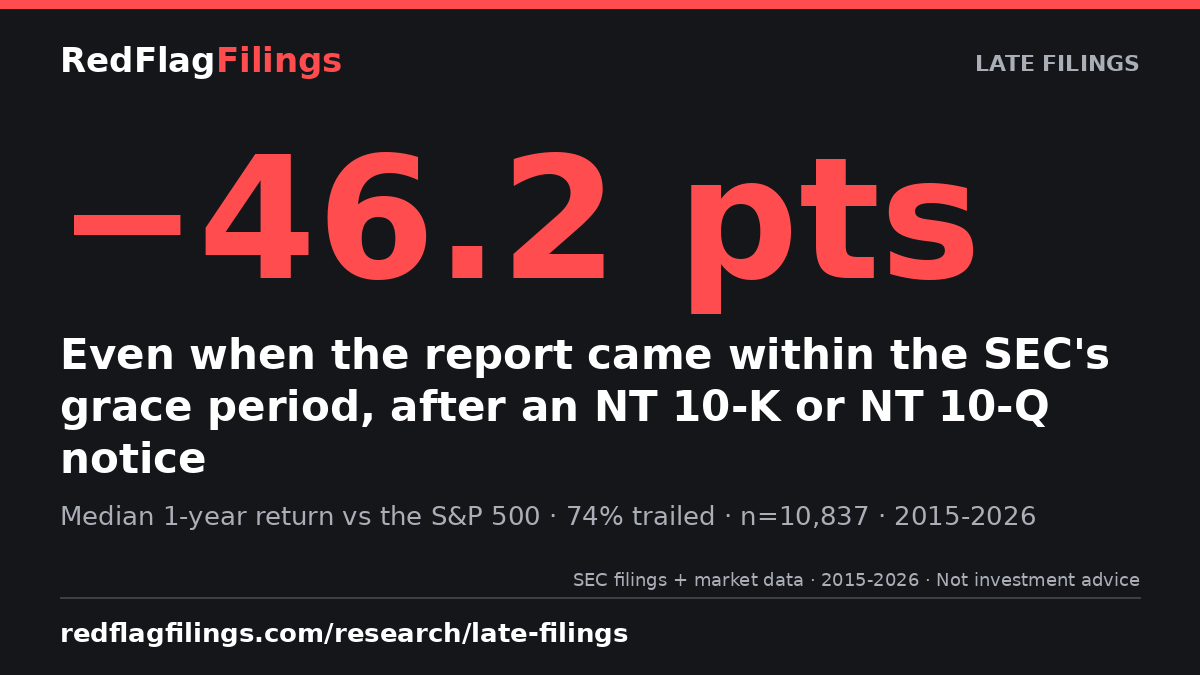
Late filings (NT 10-K / NT 10-Q): across 16,590 flags with a full year of price data (2015-2026), the median stock returned -33.7% and trailed the S&P 500 (SPY) by 46.8 percentage points over the next year; 74% did worse than SPY.
Auditor changes (8-K Item 4.01)
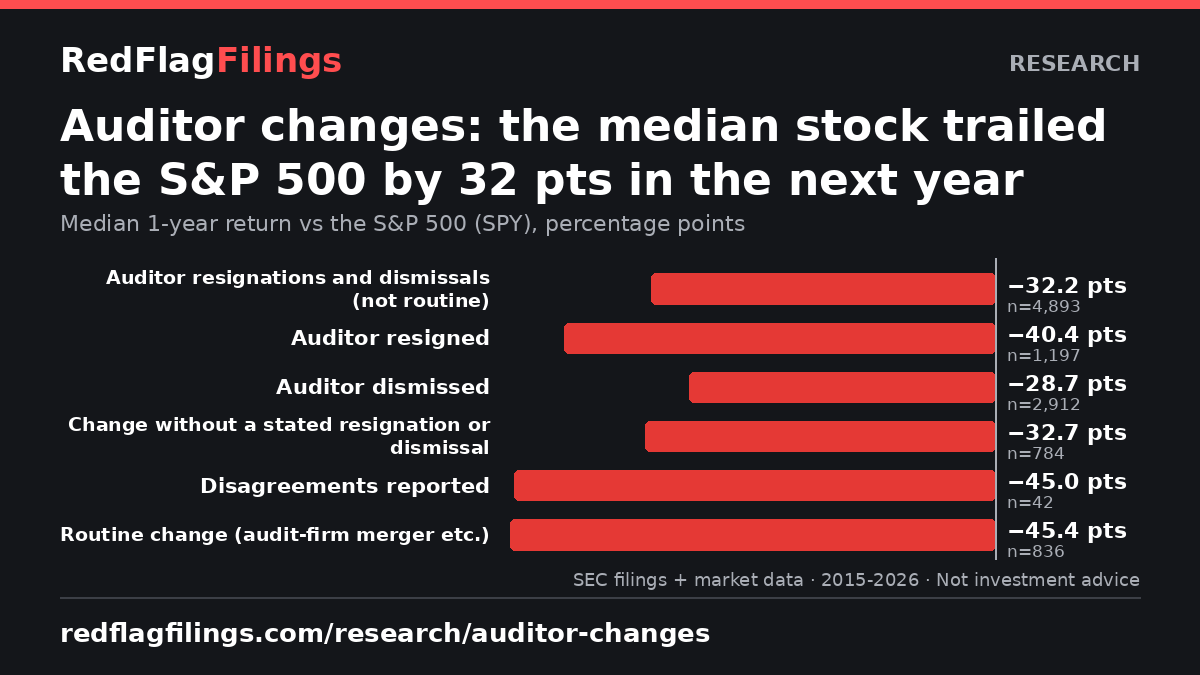
Auditor changes (8-K Item 4.01): across 4,893 flags with a full year of price data (2015-2026), the median stock returned -18.5% and trailed the S&P 500 (SPY) by 32.2 percentage points over the next year; 70% did worse than SPY.
Restatements (8-K Item 4.02)
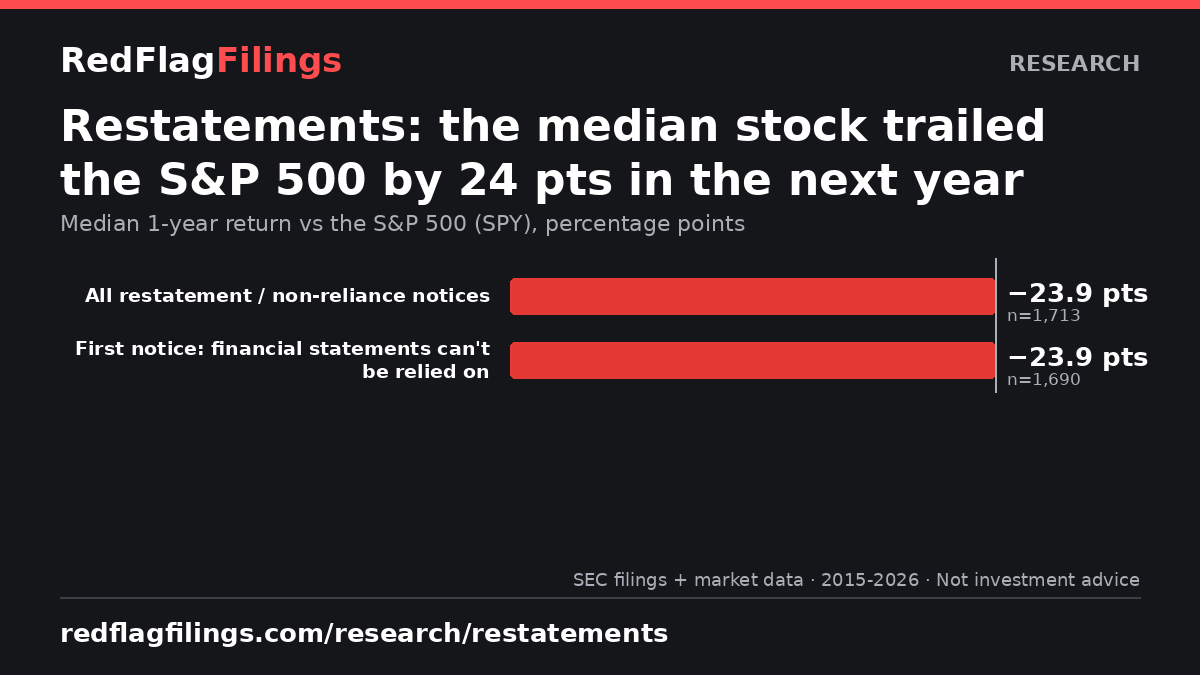
Restatements (8-K Item 4.02): across 1,713 flags with a full year of price data (2015-2026), the median stock returned -9.7% and trailed the S&P 500 (SPY) by 23.9 percentage points over the next year; 61% did worse than SPY.
Shareable charts
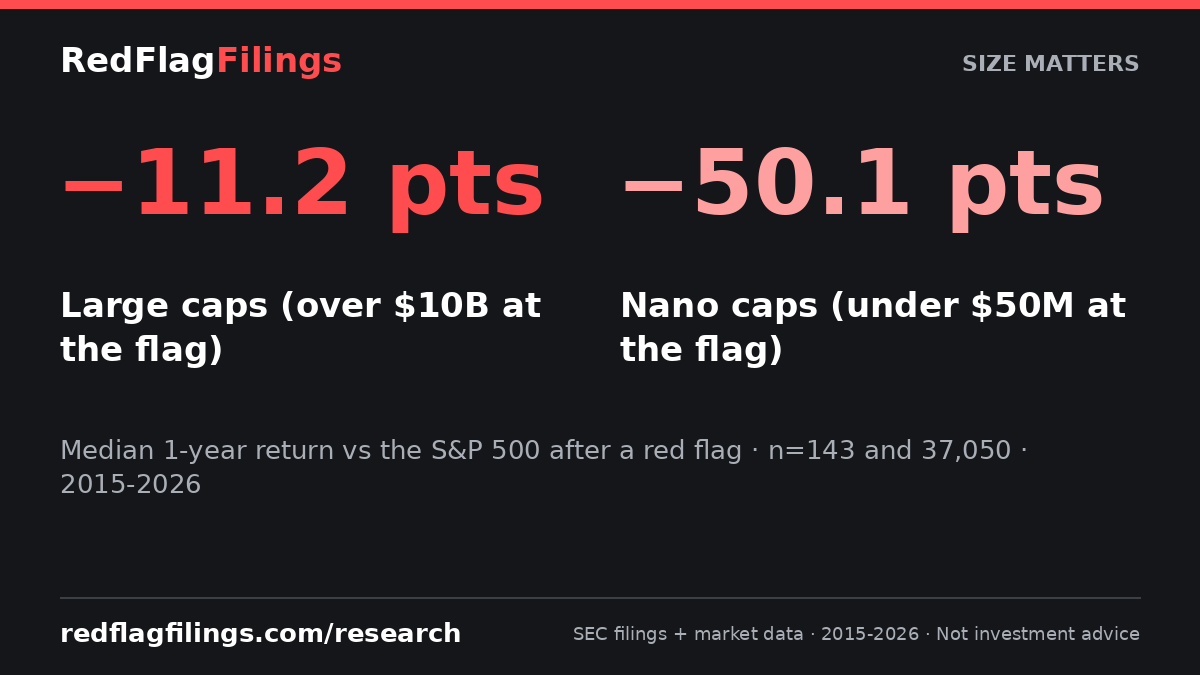
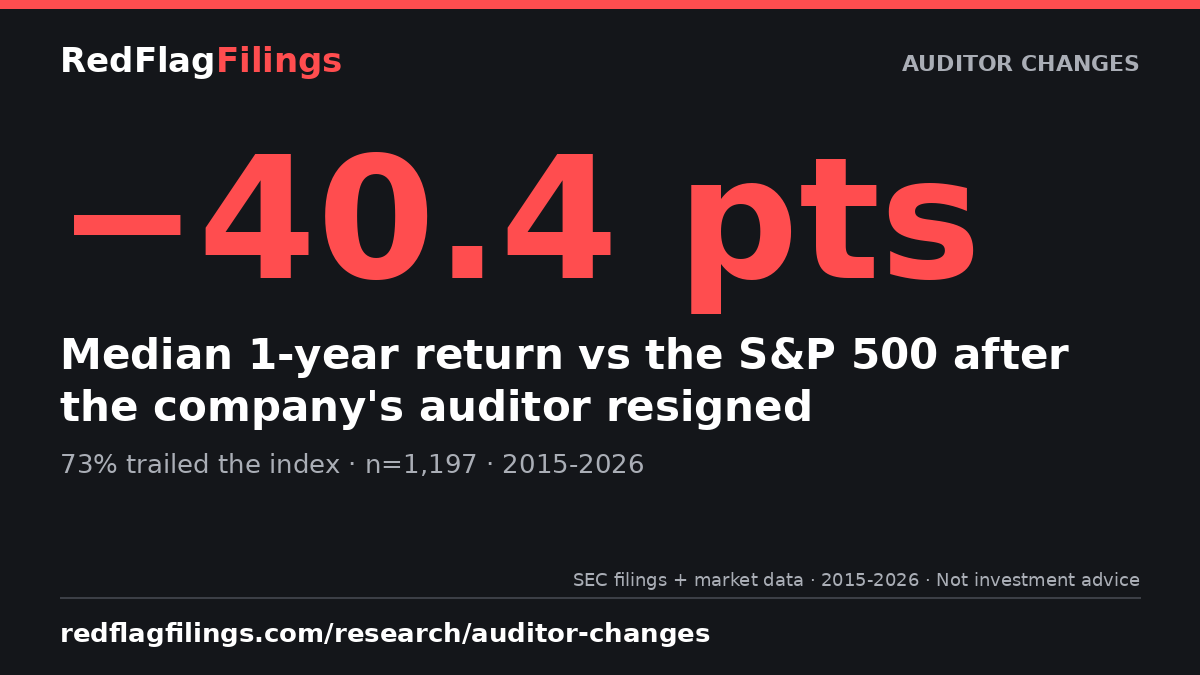
Free to share with a link to redflagfilings.com. Each chart is 1200×675 and updated with every build.
Get the weekly "Red Flags" newsletter
The week's most serious auditor changes, restatements, late filings and going-concern warnings, in plain English. Free. Unsubscribe anytime.
Subscribe to the newsletter →
The signup form didn't load here (often an ad or privacy blocker). This opens beehiiv's secure signup page.
Form not showing? Subscribe on beehiiv →
Newsletter delivered by beehiiv. See our privacy policy.