Home / Research / Auditor changes (8-K Item 4.01)
Published 2026-10-19 · updated 2026-10-19 · RedFlagFilings research · 9,421 verified flags from SEC filings, 2015-01-05 to 2026-10-16
Historical averages, not a prediction, a trading strategy or investment advice. Many flagged stocks went up.
A company must file an 8-K under Item 4.01 within four business days when its independent auditor resigns, declines to stand for re-appointment, or is dismissed. The filing has to say whether there were any disagreements with the auditor over accounting or auditing matters, and the departing auditor writes a letter (Exhibit 16) saying whether it agrees with the company's account.
Many auditor changes are routine, for example when audit firms merge or a newly public company appoints its first auditor. We show those separately and leave them out of the headline group, which covers resignations and dismissals.
| Group | 90 days after the filing | 180 days after the filing | 1 year after the filing | |||||||||||||||
|---|---|---|---|---|---|---|---|---|---|---|---|---|---|---|---|---|---|---|
| n | median return | mean return* | median vs SPY | mean vs SPY* | % trailed SPY | n | median return | mean return* | median vs SPY | mean vs SPY* | % trailed SPY | n | median return | mean return* | median vs SPY | mean vs SPY* | % trailed SPY | |
| Auditor resignations and dismissals (not routine) 8,280 flags | 5,300 | -4.2% | -5.0% | -8.5% | -8.6% | 64% | 5,166 | -8.8% | -7.8% | -16.0% | -15.0% | 68% | 4,893 | -18.5% | -10.6% | -32.2% | -24.8% | 70% |
| Auditor resigned 2,157 flags | 1,292 | -5.4% | -6.0% | -10.0% | -9.4% | 67% | 1,257 | -14.3% | -10.8% | -21.6% | -17.7% | 71% | 1,197 | -26.4% | -14.4% | -40.4% | -28.4% | 73% |
| Auditor dismissed 4,762 flags | 3,184 | -3.6% | -4.1% | -7.6% | -7.9% | 63% | 3,097 | -7.0% | -6.3% | -14.3% | -13.7% | 66% | 2,912 | -15.0% | -8.6% | -28.7% | -22.8% | 68% |
| Change without a stated resignation or dismissal 1,361 flags | 824 | -4.5% | -6.2% | -8.7% | -9.8% | 65% | 812 | -9.2% | -8.4% | -16.1% | -15.6% | 68% | 784 | -18.7% | -10.3% | -32.7% | -24.5% | 71% |
| Disagreements reported 67 flags | 42 | -22.5% | -10.9% | -21.1% | -12.7% | 71% | 42 | -13.4% | -9.6% | -11.8% | -15.2% | 64% | 42 | -39.0% | -14.2% | -45.0% | -24.9% | 71% |
| Routine change (audit-firm merger etc.) 1,141 flags | 892 | -5.4% | -5.5% | -9.8% | -10.2% | 65% | 871 | -12.3% | -11.2% | -23.0% | -20.8% | 70% | 836 | -29.3% | -20.5% | -45.4% | -35.7% | 76% |
* Mean = trimmed mean that drops the top and bottom 5% of returns (a few micro-cap returns of +1,000% or more would otherwise dominate). "vs SPY" is the stock's return minus the S&P 500 ETF's return over the same dates, in percentage points.
| Year | Flags | 90 days | 180 days | 1 year | ||||||
|---|---|---|---|---|---|---|---|---|---|---|
| n | median vs SPY | % trailed | n | median vs SPY | % trailed | n | median vs SPY | % trailed | ||
| 2015 | 1,073 | 450 | -5.5% | 62% | 451 | -12.6% | 66% | 448 | -24.4% | 66% |
| 2016 | 852 | 362 | -5.9% | 58% | 361 | -7.4% | 56% | 362 | -15.1% | 61% |
| 2017 | 802 | 399 | -5.3% | 64% | 394 | -9.9% | 63% | 394 | -21.8% | 66% |
| 2018 | 738 | 432 | -6.0% | 61% | 429 | -11.2% | 68% | 429 | -24.8% | 73% |
| 2019 | 638 | 409 | -9.0% | 65% | 409 | -15.1% | 69% | 409 | -32.8% | 73% |
| 2020 | 501 | 368 | -2.2% | 52% | 369 | -2.7% | 53% | 367 | +0.9% | 50% |
| 2021 | 547 | 434 | -14.1% | 69% | 434 | -24.1% | 72% | 429 | -43.4% | 74% |
| 2022 | 605 | 499 | -8.7% | 64% | 494 | -23.8% | 72% | 468 | -44.5% | 78% |
| 2023 | 721 | 584 | -14.5% | 72% | 571 | -26.9% | 75% | 560 | -58.1% | 80% |
| 2024 | 895 | 685 | -11.6% | 68% | 683 | -21.0% | 70% | 666 | -34.1% | 70% |
| 2025 | 513 | 430 | -9.4% | 63% | 428 | -16.9% | 67% | 361 | -36.4% | 71% |
| 2026 | 395 | 248 | -14.9% | 72% | 143 | -26.7% | 77% | 0 | too few | |
Recent years have fewer completed windows: a 1-year return needs a full year after the filing.
| Market cap at the flag | 90 days after the filing | 180 days after the filing | 1 year after the filing | |||||||||||||||
|---|---|---|---|---|---|---|---|---|---|---|---|---|---|---|---|---|---|---|
| n | median return | mean return* | median vs SPY | mean vs SPY* | % trailed SPY | n | median return | mean return* | median vs SPY | mean vs SPY* | % trailed SPY | n | median return | mean return* | median vs SPY | mean vs SPY* | % trailed SPY | |
| Nano-cap (under $50M) 2,712 flags | 2,591 | -8.8% | -3.4% | -13.0% | -7.1% | 65% | 2,518 | -17.2% | -5.2% | -23.5% | -12.6% | 68% | 2,387 | -28.6% | -3.9% | -43.4% | -18.6% | 70% |
| Micro-cap ($50M-300M) 1,360 flags | 1,324 | -2.0% | -3.7% | -7.1% | -7.4% | 64% | 1,293 | -5.0% | -6.3% | -12.9% | -13.5% | 67% | 1,217 | -11.4% | -8.8% | -25.4% | -23.4% | 69% |
| Small-cap ($300M-2B) 912 flags | 896 | -1.8% | -4.2% | -5.8% | -7.7% | 64% | 879 | -3.8% | -6.7% | -10.2% | -13.3% | 67% | 845 | -9.6% | -11.8% | -22.4% | -24.3% | 70% |
| Mid-cap ($2B-10B) 230 flags | 228 | -1.5% | -0.8% | -5.3% | -4.2% | 62% | 219 | -1.2% | +1.5% | -7.1% | -6.0% | 65% | 199 | -2.4% | -1.6% | -15.0% | -14.0% | 67% |
| Large-cap (over $10B) 70 flags | 66 | +1.6% | +1.1% | -1.2% | -1.7% | 52% | 64 | +4.2% | +3.7% | -0.6% | -2.3% | 52% | 60 | +14.7% | +14.3% | -1.3% | -1.3% | 55% |
| Market cap unknown at the flag 2,996 flags | 195 | -17.9% | -19.1% | -20.2% | -22.6% | 72% | 193 | -35.8% | -33.4% | -40.4% | -38.8% | 82% | 185 | -60.0% | -46.6% | -68.3% | -57.3% | 83% |
* Mean = trimmed mean that drops the top and bottom 5% of returns (a few micro-cap returns of +1,000% or more would otherwise dominate). "vs SPY" is the stock's return minus the S&P 500 ETF's return over the same dates, in percentage points.
| Group | 90 days | 180 days | 1 year | |||
|---|---|---|---|---|---|---|
| completed windows | delisting-adjusted | completed windows | delisting-adjusted | completed windows | delisting-adjusted | |
| Auditor resignations and dismissals (not routine) | -8.5% | -8.5% (16 stopped) | -16.0% | -15.9% (36 stopped) | -32.2% | -31.8% (95 stopped) |
| Auditor resigned | -10.0% | -9.9% (3 stopped) | -21.6% | -21.5% (11 stopped) | -40.4% | -40.4% (28 stopped) |
| Auditor dismissed | -7.6% | -7.6% (10 stopped) | -14.3% | -14.3% (21 stopped) | -28.7% | -28.4% (56 stopped) |
| Change without a stated resignation or dismissal | -8.7% | -8.6% (3 stopped) | -16.1% | -16.1% (4 stopped) | -32.7% | -31.9% (11 stopped) |
| Disagreements reported | -21.1% | -21.1% (0 stopped) | -11.8% | -11.8% (0 stopped) | -45.0% | -45.0% (0 stopped) |
| Routine change (audit-firm merger etc.) | -9.8% | -9.5% (15 stopped) | -23.0% | -22.0% (17 stopped) | -45.4% | -43.4% (25 stopped) |
Median return vs SPY. The plain figure only counts stocks that still traded at the end of the window. The delisting-adjusted figure also counts stocks that stopped trading first at their last close. Stopping can mean a delisting or bankruptcy, but also an acquisition, merger or going-private deal, and a last close can come before a later loss (for example shares that keep trading over the counter without price data), so the adjustment can move the median either way. Companies that no longer have any ticker are missing from both figures.
| Filed | Company | Flag | Market cap at the flag | 90 days vs SPY | 1 year vs SPY |
|---|---|---|---|---|---|
| 2022-04-15 | T-Mobile US, Inc. (TMUS) | Auditor change | $167B | +15.3% | +17.0% |
| 2025-09-11 | LAM RESEARCH CORP (LRCX) | Auditor change | $146B | +51.6% | +160.8% |
| 2021-11-08 | MERCADOLIBRE INC (MELI) | Auditor change | $82B | -32.3% | -25.3% |
| 2025-02-28 | CRH PUBLIC LTD CO (CRH) | Auditor change | $69B | -9.8% | -1.0% |
| 2020-02-26 | ESTEE LAUDER COMPANIES INC (EL) | Auditor change | $68B | +1.4% | +28.0% |
| 2017-09-29 | General Motors Co (GM) | Auditor change | $58B | -4.6% | -31.0% |
| 2021-11-10 | CANADIAN PACIFIC RAILWAY LTD/CN (CP) | Auditor change | $56B | -5.0% | +15.2% |
| 2023-01-13 | Monster Beverage Corp (MNST) | Auditor change | $53B | +1.2% | -5.1% |
| 2024-07-24 | FASTENAL CO (FAST) | Auditor change | $39B | +7.7% | +28.3% |
| 2018-07-26 | AIR PRODUCTS & CHEMICALS INC /DE/ (APD) | Auditor change | $35B | +1.4% | +41.8% |
| 2016-07-29 | AMERICAN ELECTRIC POWER CO INC (AEP) | Auditor change | $34B | -6.4% | -11.0% |
| 2015-03-13 | Energy Transfer Equity, L.P. (ET) | Auditor change | $33B | +9.9% | -74.7% |
Every flag in this group where the company was worth at least $10B on the filing date and its stock traded at least $25M a day (one row per company, its latest such flag, largest first). Big companies are rare in this data and are shown for context, not as a sample.
Download the numbers on this page: auditor-changes.csv · Chart image: cards/auditor-changes.png · Recent flags of this type: Auditor changes
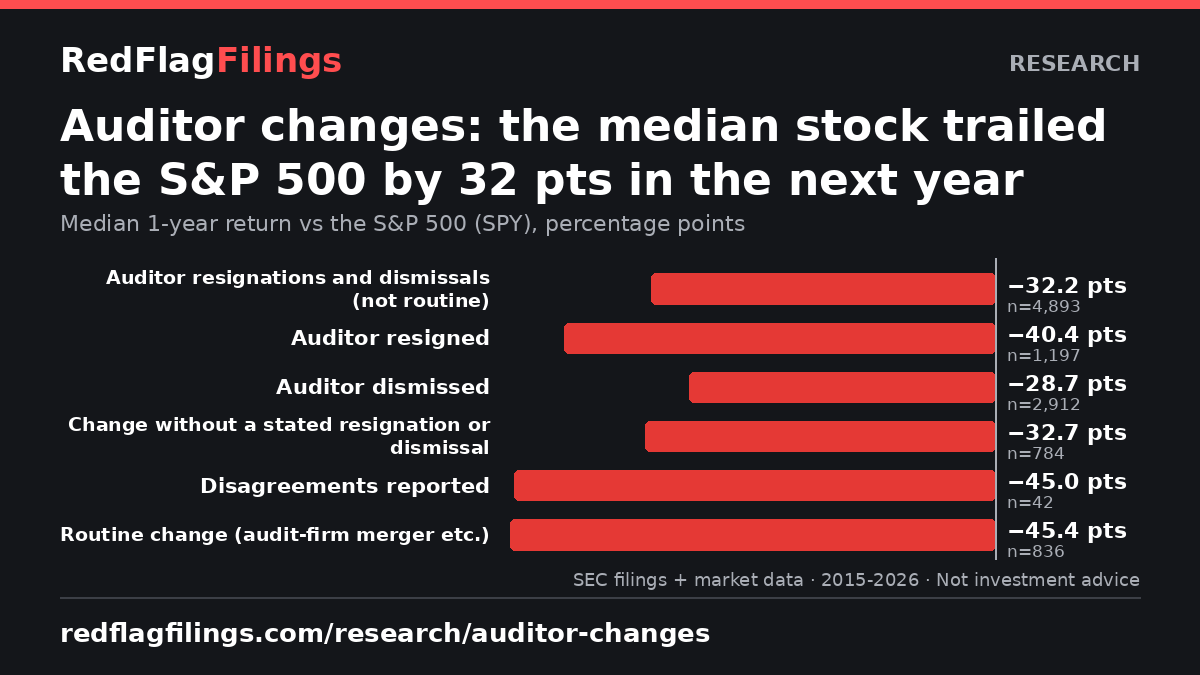
Auditor changes (8-K Item 4.01): across 4,893 flags with a full year of price data (2015-2026), the median stock returned -18.5% and trailed the S&P 500 (SPY) by 32.2 percentage points over the next year; 70% did worse than SPY.
Auditor resigned: median 1-year return vs SPY -40.4%, 73% trailed SPY (n=1,197). Auditor dismissed: median 1-year return vs SPY -28.7%, 68% trailed SPY (n=2,912). Change without a stated resignation or dismissal: median 1-year return vs SPY -32.7%, 71% trailed SPY (n=784). Disagreements reported: median 1-year return vs SPY -45.0%, 71% trailed SPY (n=42). Routine change (audit-firm merger etc.): median 1-year return vs SPY -45.4%, 76% trailed SPY (n=836).
95 of these stocks stopped trading within a year; counting them at their last trade moves the 1-year median vs SPY from -32.2% to -31.8%.
By size: large caps (over $10B) -1.3% vs SPY over a year (n=60); nano caps (under $50M) -43.4% (n=2,387).
No. These are historical averages computed from SEC filings and market data. They are not a prediction or a recommendation to buy or sell any security, and many flagged stocks went up.
The week's most serious auditor changes, restatements, late filings and going-concern warnings, in plain English. Free. Unsubscribe anytime.
Subscribe to the newsletter →
The signup form didn't load here (often an ad or privacy blocker). This opens beehiiv's secure signup page.
Form not showing? Subscribe on beehiiv →
Newsletter delivered by beehiiv. See our privacy policy.